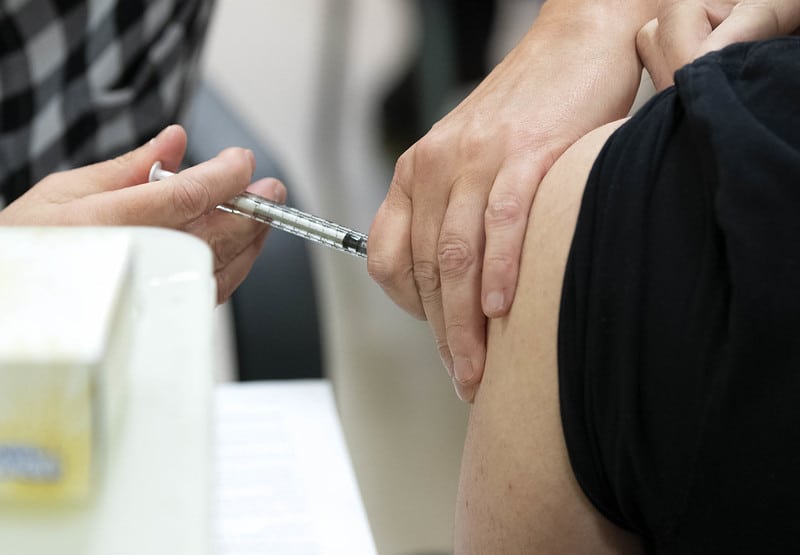
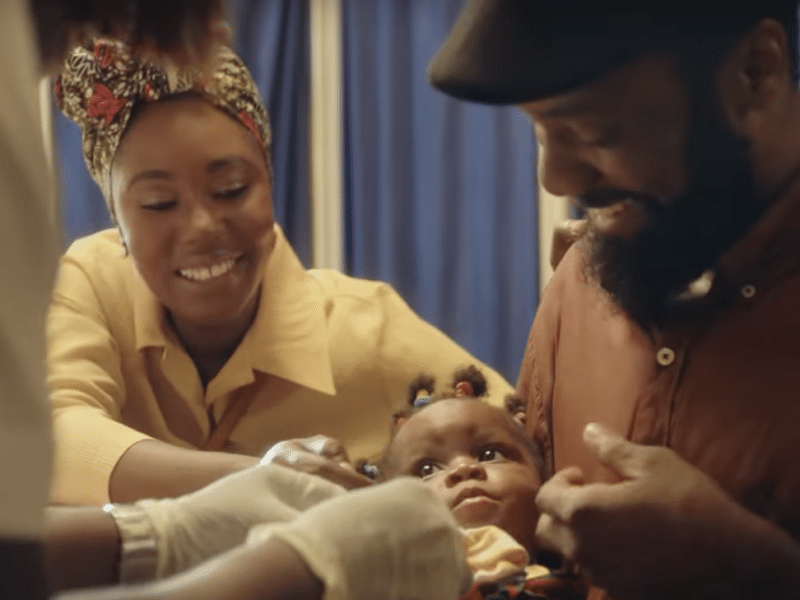
Now that COVID-19 vaccines are available to priority populations such as health care workers and the elderly, communication practitioners and public health policymakers need to address the issues of vaccination acceptance and hesitancy.
Across the globe, low rates of vaccine acceptance continue to be a concern. New data released this week by the Johns Hopkins Center for Communication Programs suggest that only 63 percent of respondents across 23 countries will accept a vaccine. That is well below the 75 percent minimum estimate public health experts have recommended for a population to reach “herd immunity,” or the point where a large enough portion of the community is immune to COVID-19 to make further spread unlikely.
The data suggest that while there is a large segment of the population anxious to be vaccinated immediately and a much smaller group adamantly opposed to getting a shot, there is a sizable portion in the middle who are undecided and can be motivated to get the vaccine. Those are the people who deserve the most attention from health communication professionals, says CCP’s Executive Director Susan Krenn.
“We need to understand who is on the fence and we need to get them the information they need to get off the fence and choose to be vaccinated,” she says. “And as a recent New York Times article wisely noted, we need to be clear and positive in our messaging: This is an incredibly effective vaccine, and it will save your life.”
The KAP COVID dashboard presents data from a global survey of knowledge, attitudes and practices around COVID-19. It is a collaboration among CCP, Facebook Data for Good and MIT, and the World Health Organization and Global Outbreak Alert and Response Network served as advisors.
The findings allow researchers, public health programmers and policymakers to compare changes in behaviors and attitudes over time and informs further research related to the development of messages.
The new dashboard focusing solely on vaccines is drawn from more than a dozen waves of the KAP COVID surveys conducted since July 2020.
Among the findings: In the United States, 62 percent of respondents in December said they would probably or definitely get the vaccine, while 20 percent said they would probably or definitely not get it. That’s a major improvement from September, when a low of 39 percent said they would get a vaccine if it became available. Meanwhile, those under 30 currently have the lowest acceptance rates at 58 percent, while men are more likely than women and urban residents are more likely than rural ones to say they plan to get vaccinated.
Those who are unsure about vaccination said that information from health care workers or WHO could help change their minds, while messages from politicians would be unlikely to resonate.
This type of information helps public health officials better understand who needs to be hearing messages about the great benefits of vaccination and how to best reach them.
“We, as communicators, need to understand and respond to people’s concerns and hesitancy,” Krenn says. “It’s not something to ignore. Messages that contain accurate information with transparent updates are essential. It’s not clear that the risk of COVID-19 and the associated long-term health impacts are well understood. And there is a very minimal risk related to the vaccine.”
Says Douglas Storey, director for communication science and research at CCP: “We also need to recognize that communication about vaccination must be an ongoing dialogue among scientists, policymakers and the public as the situation evolves and changes. It’s not just a matter of disseminating the latest data. We must also respond in good faith to concerns as they arise in real time, while emphasizing the nearly complete efficacy of the vaccines to prevent infection and sharing testimonials from those it has helped.”
The COVID-19 pandemic has killed more than 2 million people worldwide including more than 400,000 in the United States, according to Johns Hopkins University. Cases globally top 95 million since the virus that causes COVID-19 was discovered a year ago, with more than 24 million cases in the United States alone.
The new series of visualizations show by country, by WHO region and by survey ‘wave’ (two-week periods from July through December) show how different types of people responded to questions related to vaccine acceptance. It allows those in public health to look at trends over time. More than 1.5 million people have participated in the surveys since July 2020.
Updated data has been added to previous visualizations based on new information collected through December 7.
Update
As of September 2021, a new dashboard is available visualizing data from an updated survey, the COVID-19 Trends and Impact Survey. Visit covidbehaviors.org for data from 114 countries, as well as printable country-specific reports.
covidbehaviors.org


