


Subscribe to CCP's monthly newsletter
Receive the latest news and updates, tools, events and job postings in your inbox every month
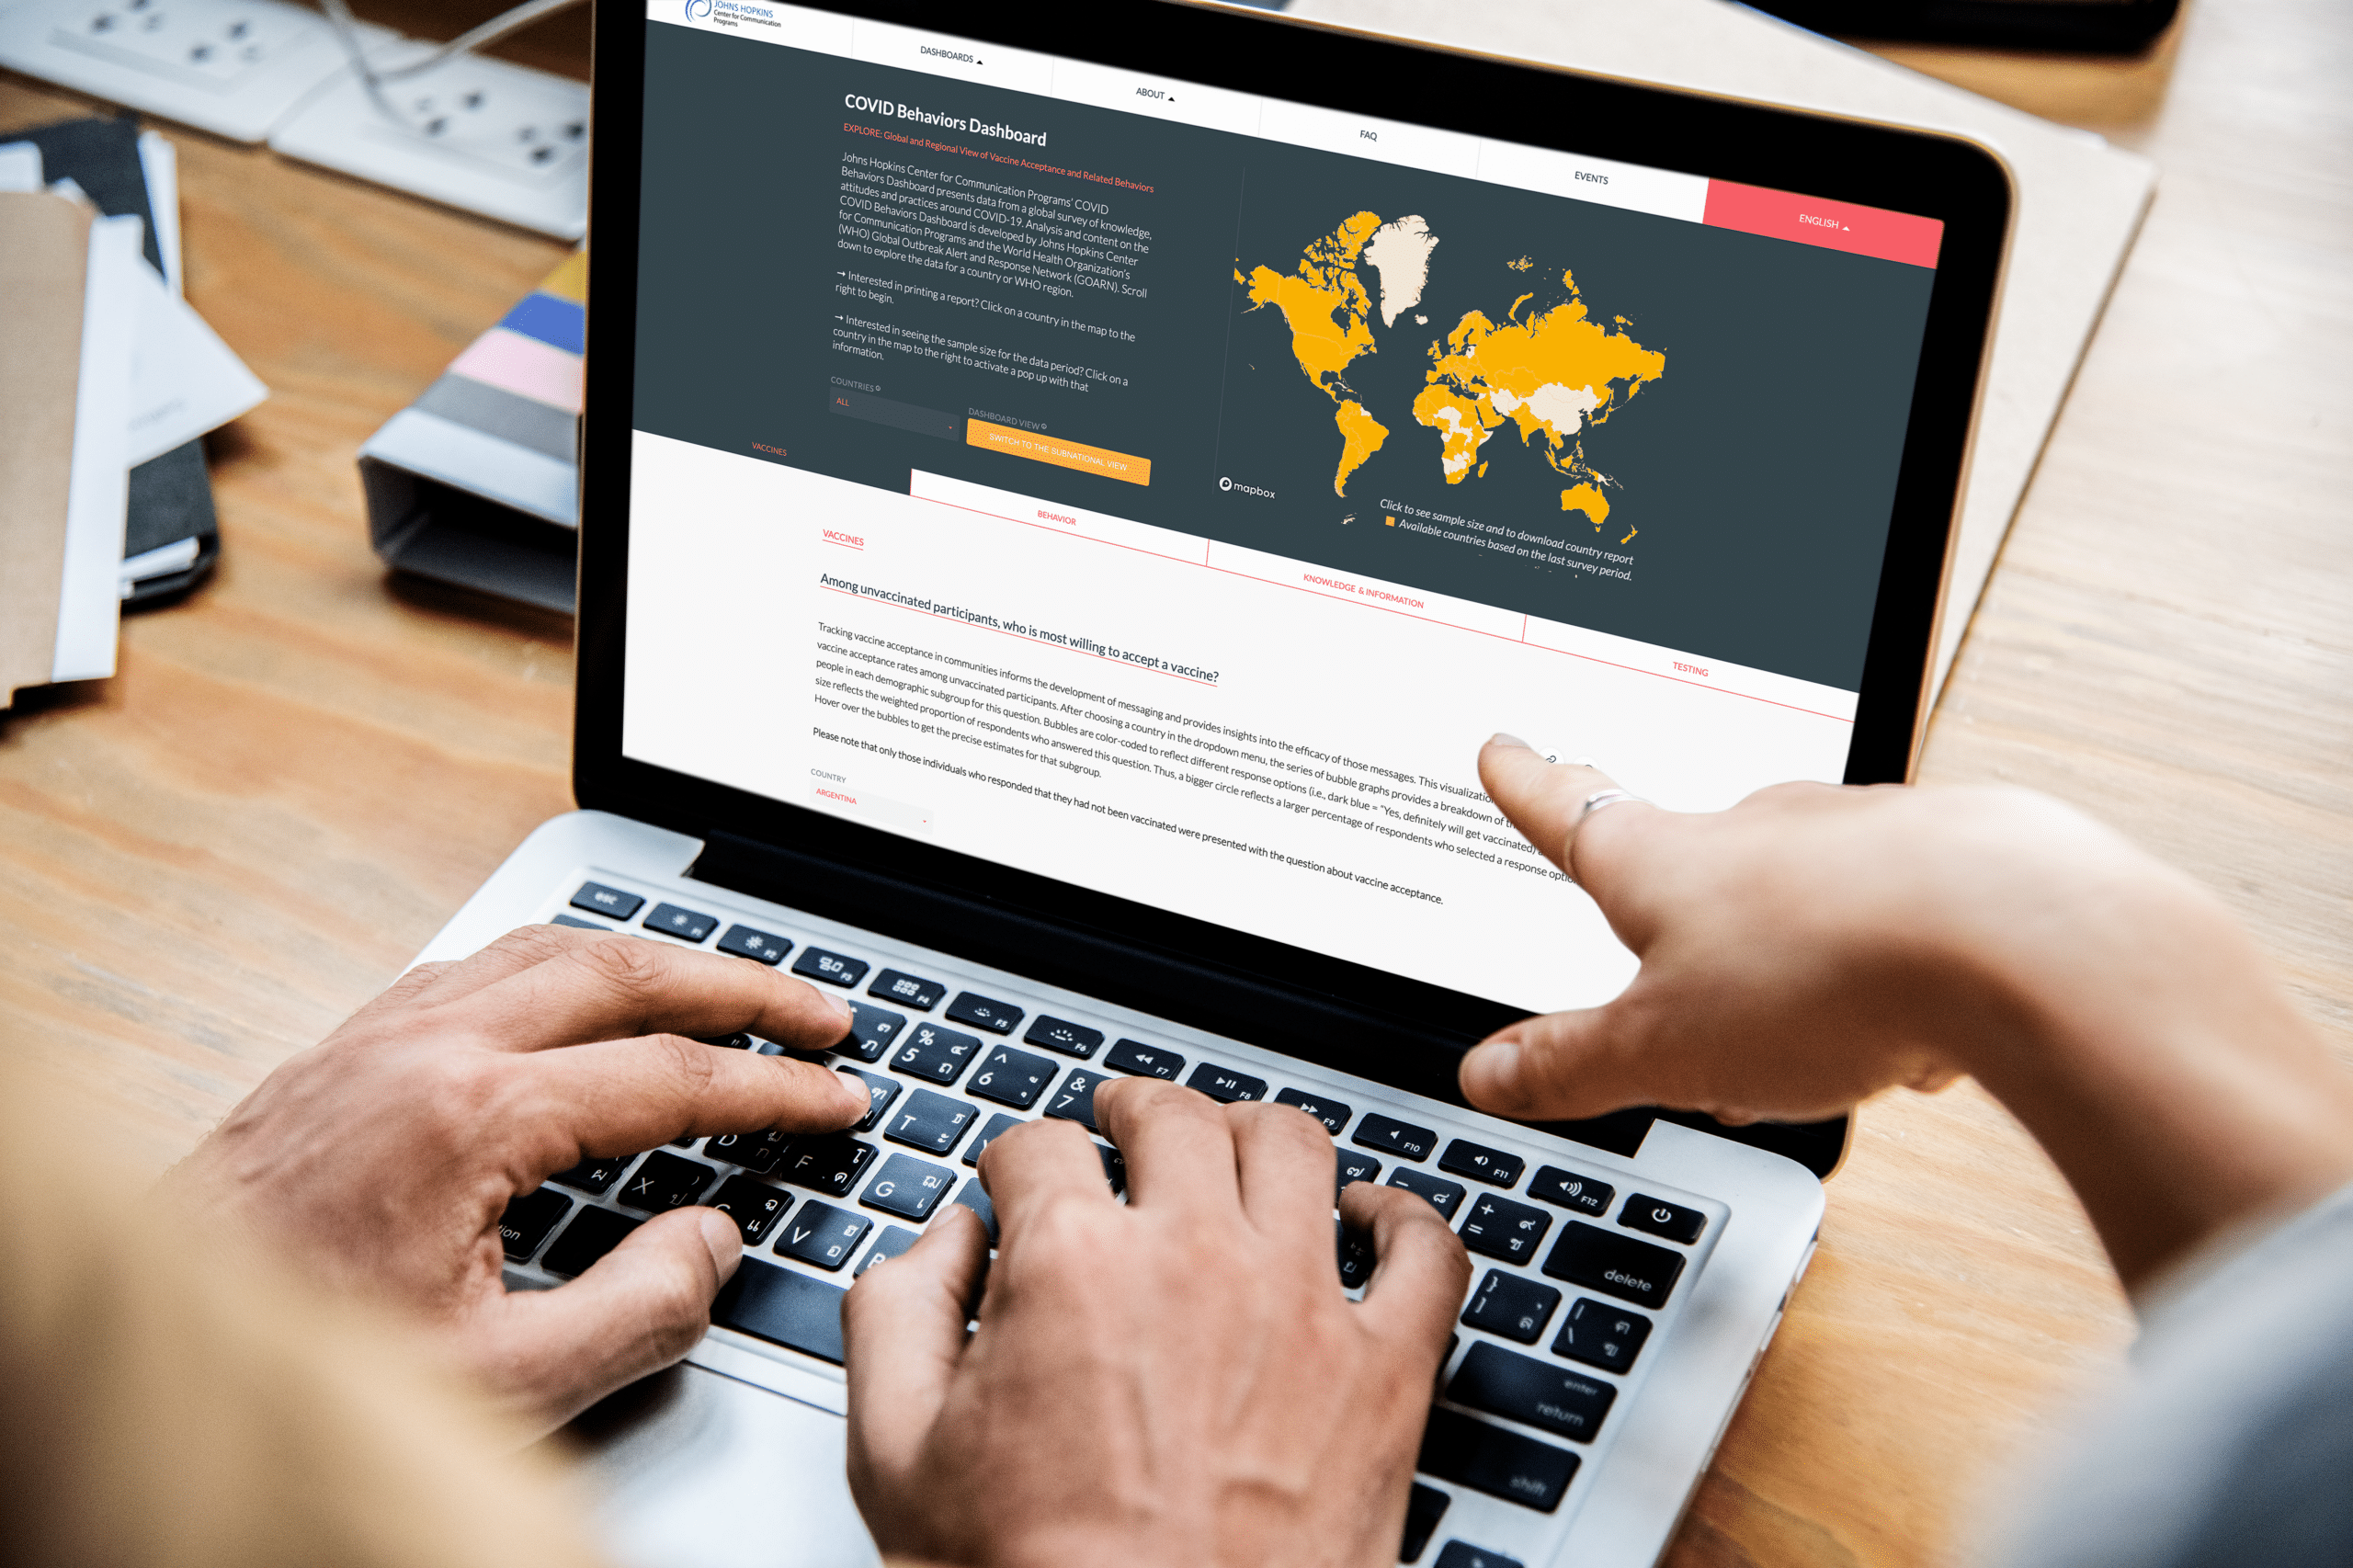
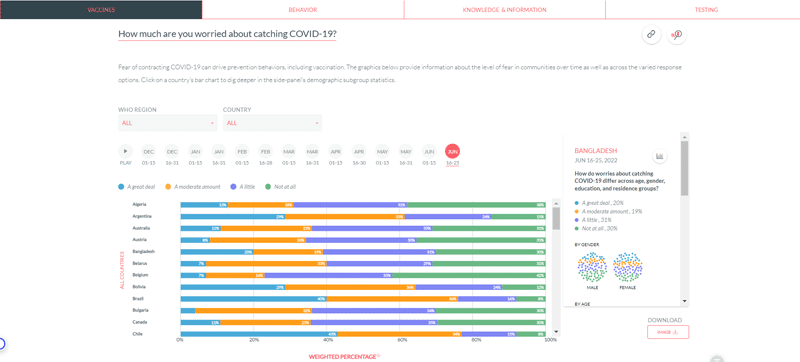
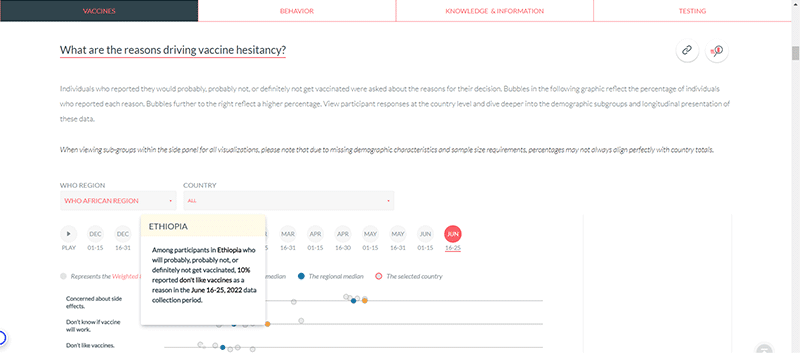
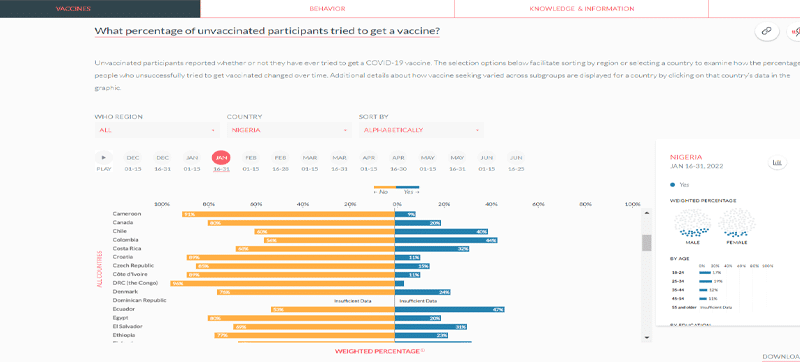
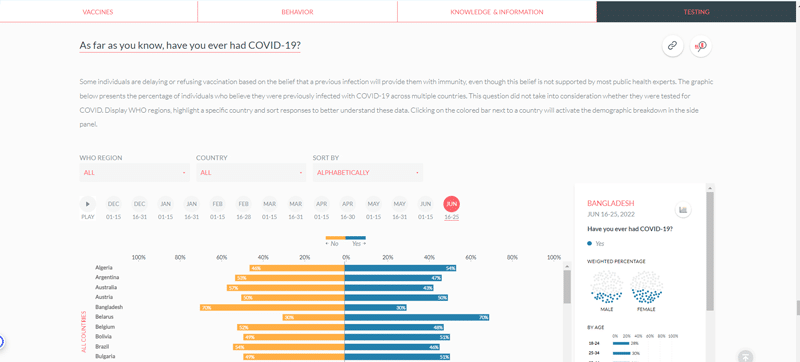
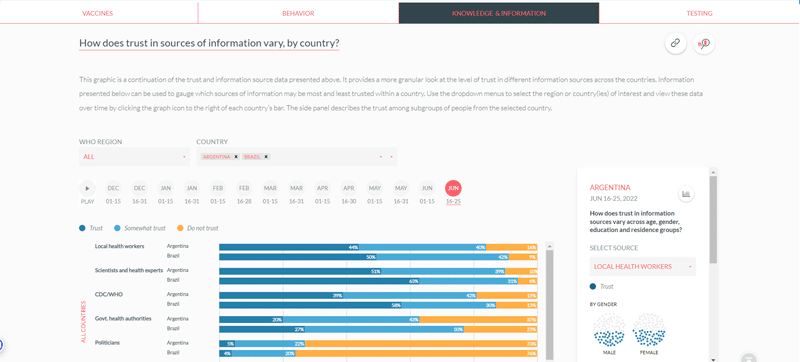
The Johns Hopkins Center for Communication Programs (CCP) COVID Behaviors Dashboard was designed to facilitate the interpretation and strategic use of data by program managers, researchers, academics, and policy makers to better understand the behavioral drivers behind vaccine uptake, masking and physical distancing among other behaviors affecting the spread of COVID-19. The dashboard went live in September 2021, and visualized data from 15 survey questions around the topics of vaccines, behavior, knowledge and information and testing.
The COVID Behaviors Dashboard visualized data at both the national and subnational levels in 115 countries, collected from August 16, 2021 to June 25, 2022 through the COVID-19 Trends and Impact Survey, a global daily survey of Facebook users implemented by the Delphi Group at Carnegie Mellon University and the University of Maryland Social Data Science Center in partnership with Facebook/Meta. The COVID Behaviors Dashboard was retired in June 2024, however data requests for the United States can be made on the Delphi Group at Carnegie Mellon University website and for all other countries on the University of Maryland Social Data Science Center’s website.
Below is a sampling of visualizations from the dashboard.
Beyond the visual display of the responses, CCP provided explanations on how to use the data programmatically and in advocacy efforts and promoted data utilization. The data and dashboard were presented in global webinars where participants represented ministries of health, universities, international non-governmental and grassroots organizations, as well in dozens of direct engagements which included organizations such as the World Bank, UNICEF, WHO and the European CDC.
These briefs included:
April 26, 2022
Researchers and public health practitioners presented their findings on mental health during the COVID-19 pandemic. Topics included men’s mental wellness as well as the impact of non-pharmaceutical interventions to prevent COVID-19 (such as stay-at-home orders, workplace closures, and social venue closures) on wellness in 43 countries. An established mental health approach that could be utilized by program implementers was also discussed.
December 2, 2021
Speakers from UNICEF, Gates Foundation and USAID’s flagship social and behavior change project, Breakthrough ACTION shared how they have used data from the COVID Behaviors Dashboard in their work.
September 21, 2021
Behavioral researchers at Johns Hopkins Center for Communication Programs presented the new COVID Behaviors dashboard, showing the collected survey data of more than 10 million adults in 100+ countries. Topics included reported reasons for vaccine hesitancy and structural barriers to vaccination. Presenters also illustrated variation across gender, age groups and regions. Future presentations will provide an overview of social norms and related prevention behaviors.
The COVID Behaviors dashboard was retired in June 2024, however data requests for the United States can be made on the Delphi Group at Carnegie Mellon University website and for all other countries on the University of Maryland Social Data Science Center’s website.
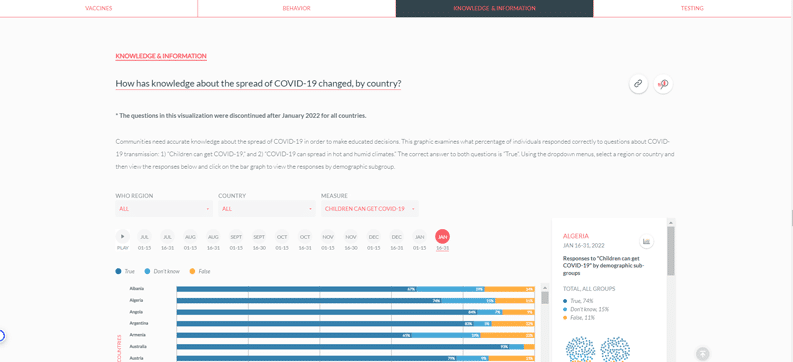
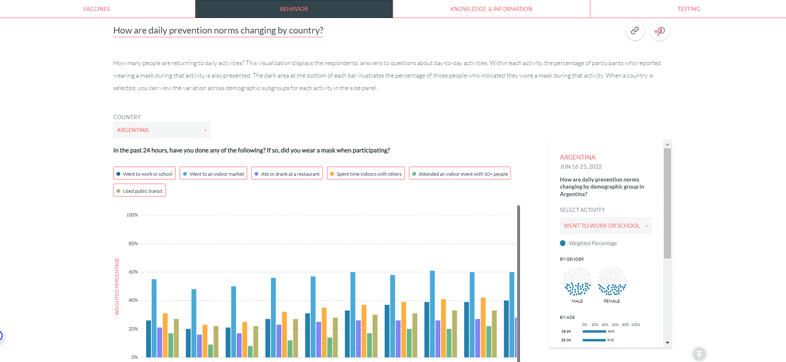
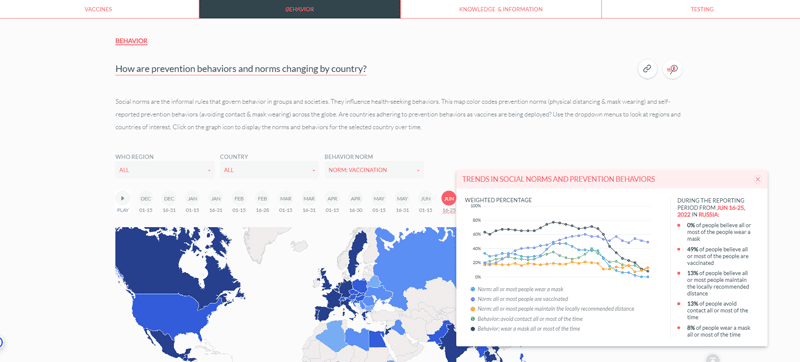
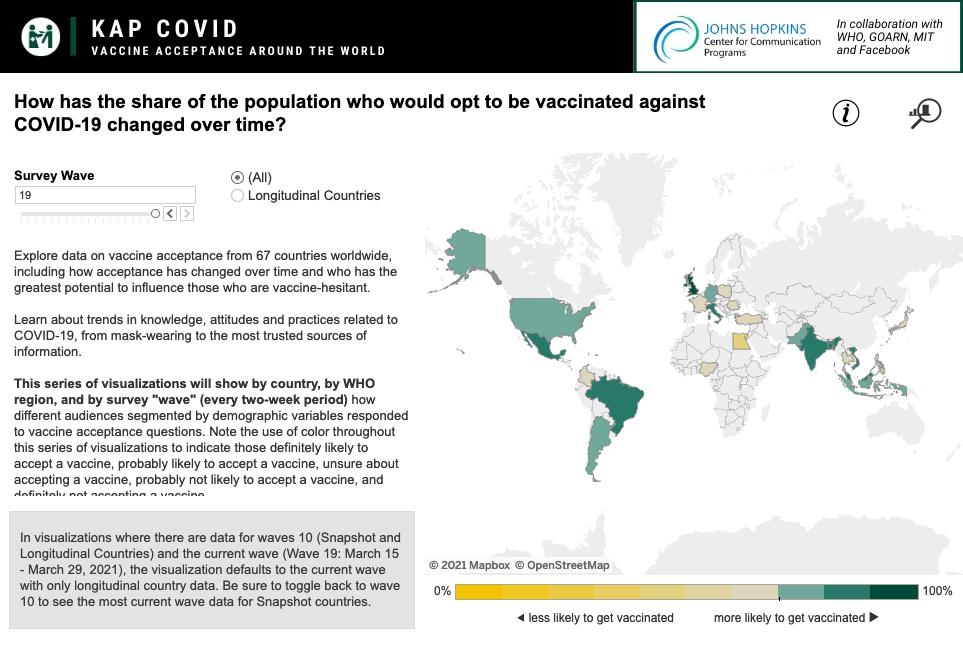
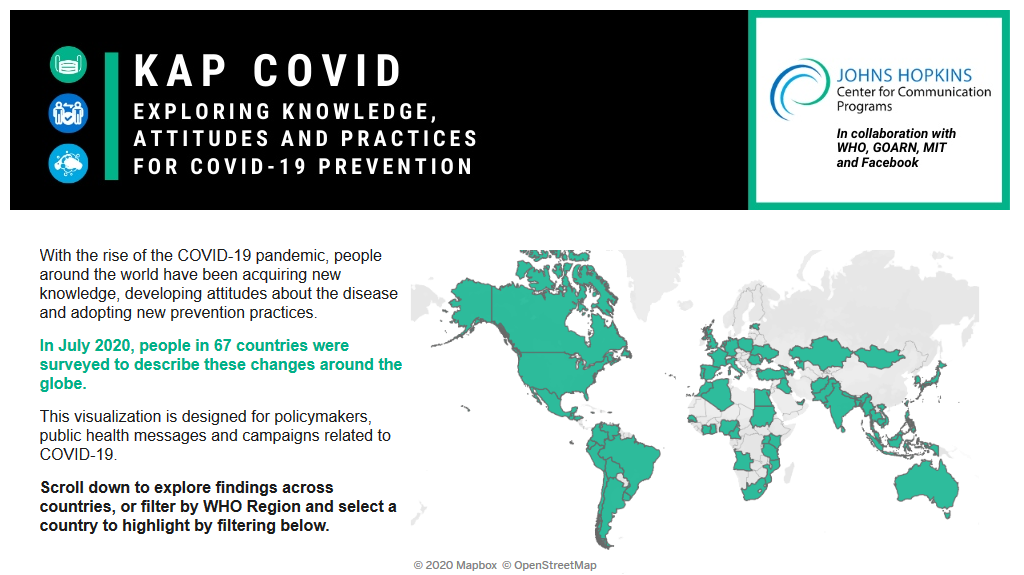
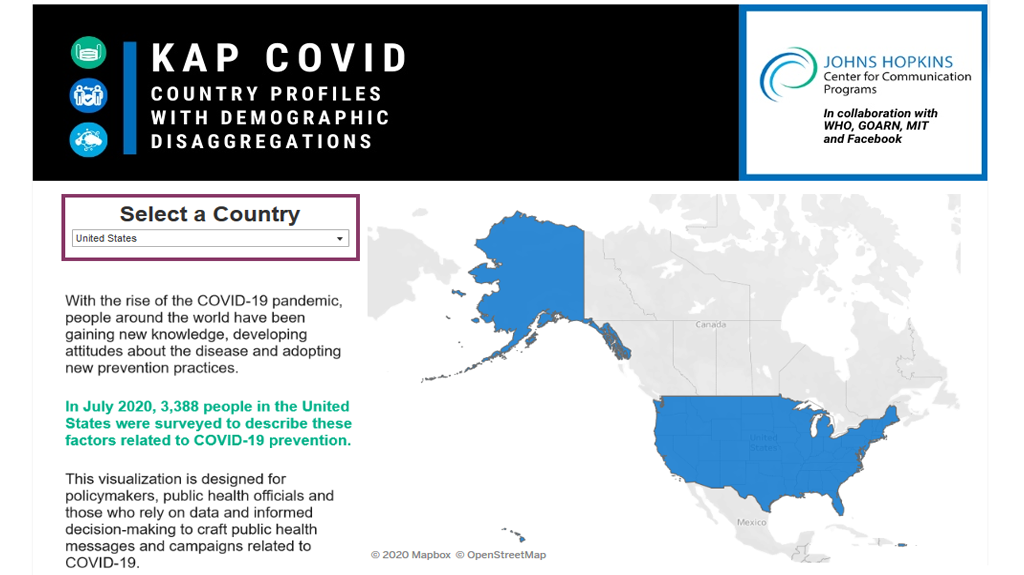
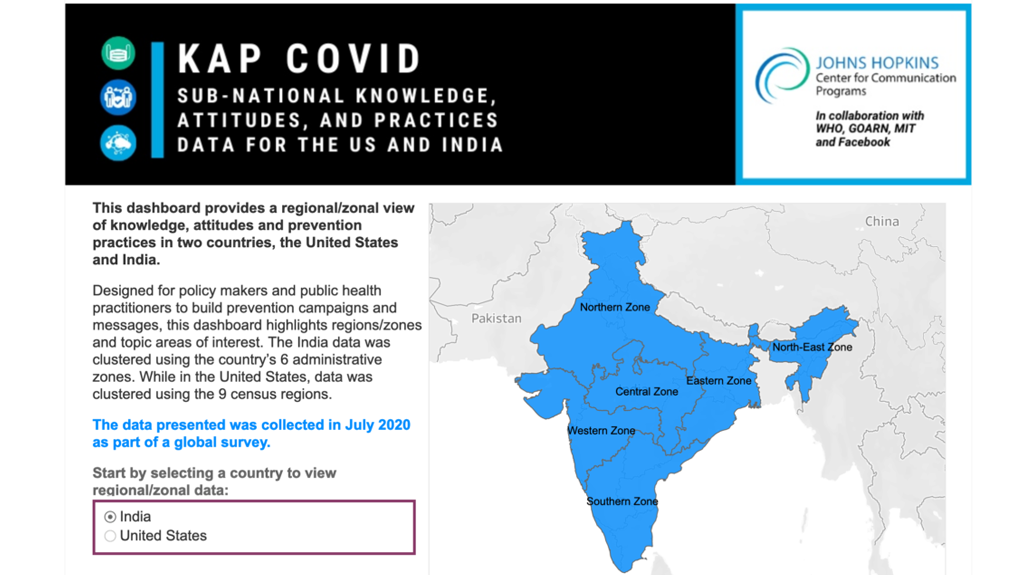
The KAP COVID series of data visualizations was the precursor to the COVID Behaviors dashboard. These dashboards visualize and disseminate data on knowledge, attitudes, and practices around COVID-19, collected from more than 1.7 million people in 67 countries from June 2020– March 2021. The goal was to ensure those who needed the data – policy makers, public health practitioners and WHO officials – were able to use it for decision-making in COVID-19 mitigation and vaccination efforts.
Most recent data from March 29, 2021.
Most recent data from March 29, 2021.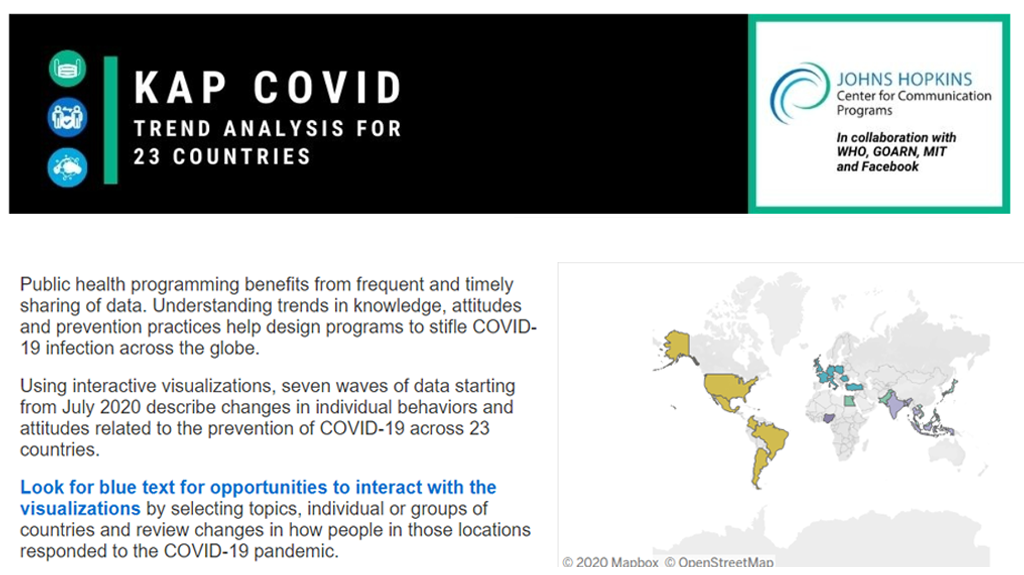
Most recent data from November 2020.
Most recent data from November 2020.
Read the COVID Behaviors Dashboard and KAP COVID Study Methods (includes links to the survey questions and data source).
Contact Marla Shaivitz – marla.shaivitz@jhu.edu
Babalola, S., Krenn, S., Rosen, JG., Serlemitsos, E., Shaivitz, M., Storey, D., Tsang, S., Tseng, TY., Shattuck, D. COVID Behaviors Dashboard. Johns Hopkins Center for Communication Programs in collaboration with Facebook Data for Good, Delphi Group at Carnegie Mellon University, University of Maryland Social Data Science Center, Global Outbreak Alert and Response Network. Published September 2021.
Receive the latest news and updates, tools, events and job postings in your inbox every month